Greater Vancouver housing market hits summer lull, or does it?
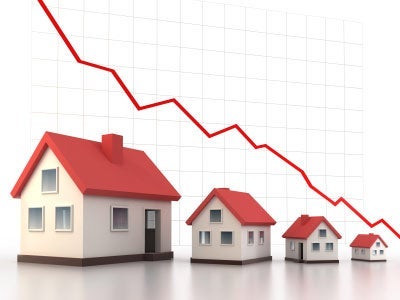 The Real Estate Board of Greater Vancouver just released it's July 2012 statistics indicating a summer lull. Residential property sales in Greater Vancouver remained at a 10-year low in July, while the number of properties being listed for sale continued to edge down and prices remained relatively stable.
The Real Estate Board of Greater Vancouver (REBGV) reports that residential property sales of detached, attached and apartment properties in July declined 18% compared to the sales in July 2011 and 11% compared to the previous month’s sales. This is 31% below the 10-year July sales average.
“People appear to be cautious about making significant financial decisions right now. While our local economy appears to be quite robust, there may be some concern about the impact of international markets and the federal government’s tightening of mortgage regulations,” says Eugen Klein, REBGV president.
New listings for detached, attached and apartment properties in Greater Vancouver in July are the lowest number for any month this year. This represents a 5% decline compared to July 2011 and a 15% decline compared to the new listings reported in June 2012. The total number of active residential property listings (includes new and existing listed properties) on the MLS® increased 19% per cent from this time last year and decreased 2% per cent compared to the previous month.
With an overall sales-to-actives-listing ratio of 11.6 per cent in the Greater Vancouver area, conditions have favoured buyers in our marketplace in recent months. That means buyers have more selection to choose from and more time to make a decision. For sellers in this kind of market, it’s important to price properties competitively.
The formula for determining whether when are in a Buyer's Market or a Seller's Market is such: a Sales-to-Active listings ratio above 21% indicates a Seller's market; between 15-20% indicates a balanced market; and anything below 14% means we are in a Buyer's market.
Now, it's important to know that just because the overall Greater Vancouver statistics indicate that we are in a Buyer's market, does not necessarily make this true for all cities and communities in Greater Vancouver. Depending on the neighbourhood and type of property you are wanting to buy or sell, prices can vary significantly from one area to another. It could be a Buyer's market for condos and a Seller's market for detached properties in the same community. To demonstrate, here are the July statistics for West Vancouver and North Vancouver:
West Vancouver
Sales- Detached 46
- Attached 2
- Apartment 17
New Listings
- Detached 131
- Attached 11
- Apartment 32
Active Listings
- Detached 533
- Attached 55
- Apartment 106
Sales-to-Active Listings Ratio
- Detached 8.6% (Buyer's Market)
- Attached 3.6% (Buyer's Market)
- Apartment 16% (Balanced Market)
North Vancouver
Sales- Detached 60
- Attached 26
- Apartment 55
New Listings
- Detached 128
- Attached 53
- Apartment 139
Active Listings
- Detached 406
- Attached 128
- Apartment 477
Sales-to-Active Listings Ratio
- Detached 14.8% (Balanced Market)
- Attached 20.3% (Balanced Market, on the cusp of a Seller's Market)
- Apartment 11.5% (Buyer's Market)
Please contact me for statistical information on cities/neighbourhoods not listed here.